This document contains results of automated tests of the waveform availability of European EIDA stations and the responsiveness of the EIDA servers to metadata requests.
Availability test of EIDA stations using Python obspy library.
The code does not use the waveform catalog, therefore empty waveform returns are due to data gaps or due to problems in data access and delivery.
Statistics on random requests between 14-03-2026 and 14-06-2026 00:32 using station metadata valid since 14-06-2025.
Counters:
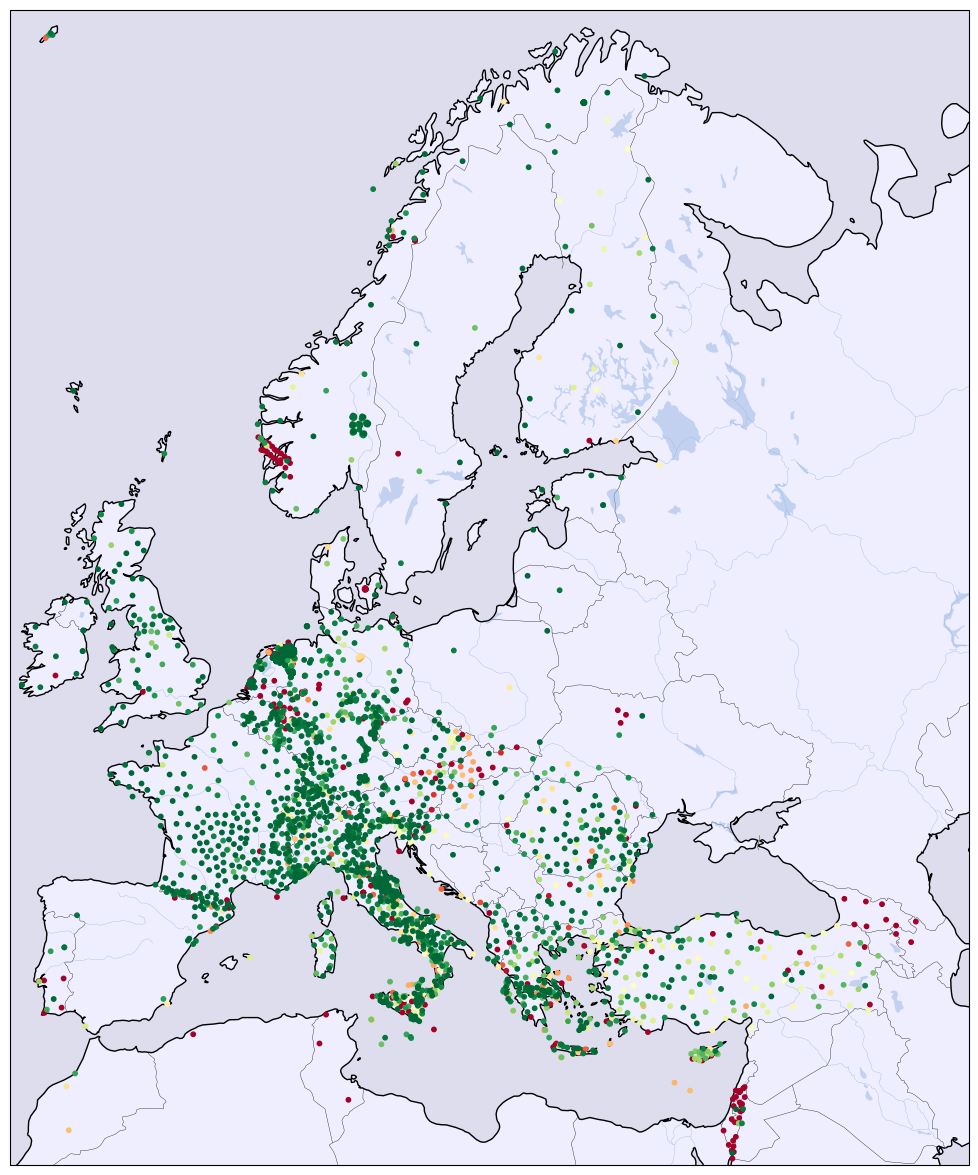
HHZ,BHZ,EHZ,SHZ: 3351Color coded plot of evaluated EIDA stations. Shows results of 124880
random requests between 14-03-2026 and 14-06-2026. The availability
displayed is computed as the relative number of request results with
status OK (see table below) compared to the number of all
requests to this station.
Request status statistics of networks:
| net | OK |
OK in % |
NODATA |
FRAGMENT |
INCOMPL |
METAFAIL |
NOSERV |
RESTFAIL |
|---|---|---|---|---|---|---|---|---|
| 1D 1I 2D 2I 3D 4P 5A 5B 7B 7F 8D 8R 9L 9S AB AC BE BN BQ BS BW C4 CA CH CL CP CQ CR CZ DK DL DY DZ EB EE EI ES FN FO FR GB GE GO GR | |
|
|
|
|
|
|
|
Request status statistics of networks (continued):
| net | OK |
OK in % |
NODATA |
FRAGMENT |
INCOMPL |
METAFAIL |
NOSERV |
RESTFAIL |
|---|---|---|---|---|---|---|---|---|
| GU GX HA HC HE HF HL HP HS HT HU IP IS IV IX IY JS K3 KO KQ LC LE LU LX M1 MD ME MK ML MN MT NI NL NO NR NS OE OT OX PL PM QE QM RD | |
|
|
|
|
|
|
|
Request status statistics of networks (continued):
| net | OK |
OK in % |
NODATA |
FRAGMENT |
INCOMPL |
METAFAIL |
NOSERV |
RESTFAIL |
|---|---|---|---|---|---|---|---|---|
| RF RN RO SI SJ SK SL SS ST SX TH TQ TT TU TV UD UP UR UT VI VM WE WM XE XP Y8 YV Z6 ZO | |
|
|
|
|
|
|
|
Status codes used in above statistics:
OKOK in %NODATAFRAGMENTINCOMPLMETAFAILNans)
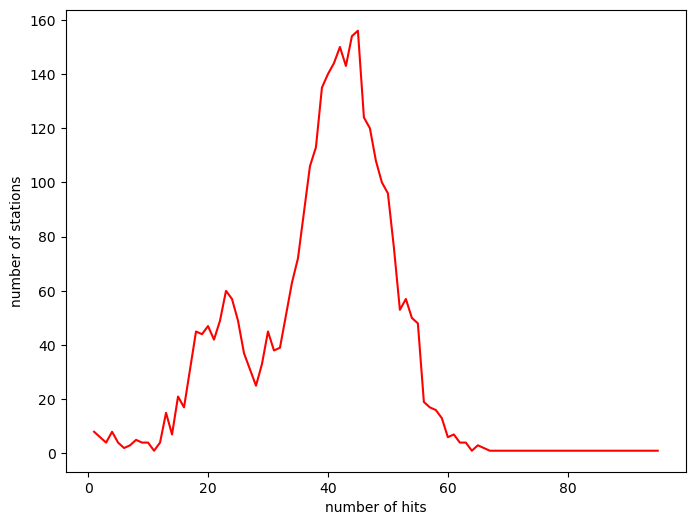
NOSERVRESTFAILHow many stations have how many hits of random requests.
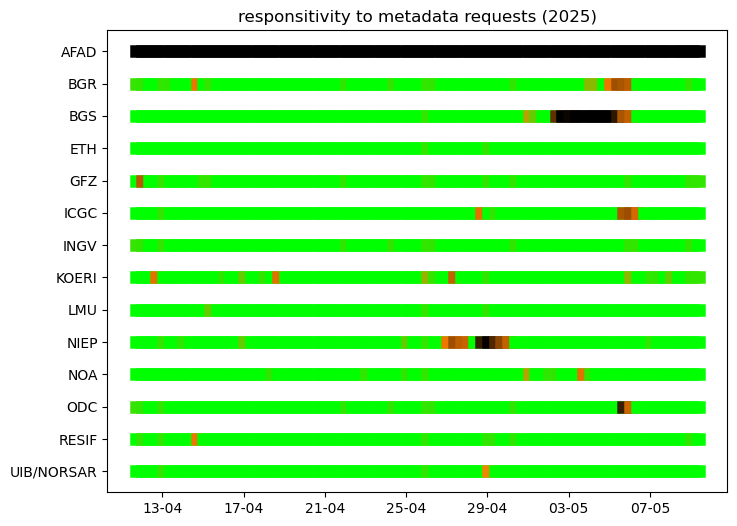
This section contains results of inventory test requests on network, station and channel level. A few times per hour all servers get direct metadata requests followed by a metadata request using the routing client of obspy. It is checked whether all servers respond to the direct requests and whether all servers contribute to the routed request. The following results refer to tests carried out since 17-05-2026 00:32:02.
totals: direct requests 2014, routed requests 2014, federator requests 2014
Number of failed requests and failure rates of servers:
| server | direct | routed | federator |
|---|---|---|---|
| AFAD | 2014 (100.0%) | 2014 (100.0%) | 1885 (100.0%) |
| BGR | 11 ( 0.5%) | 81 ( 4.0%) | 46 ( 2.4%) |
| BGS | 1 ( 0.0%) | 48 ( 2.4%) | 1885 (100.0%) |
| ETH | 5 ( 0.2%) | 1 ( 0.0%) | 24 ( 1.3%) |
| GFZ | 8 ( 0.4%) | 9 ( 0.4%) | 778 (41.3%) |
| ICGC | 0 ( 0.0%) | 74 ( 3.7%) | 43 ( 2.3%) |
| IGN | 1200 (59.6%) | 1 ( 0.0%) | 1073 (56.9%) |
| INGV | 50 ( 2.5%) | 44 ( 2.2%) | 31 ( 1.6%) |
| KOERI | 1 ( 0.0%) | 3 ( 0.1%) | 180 ( 9.5%) |
| LMU | 0 ( 0.0%) | 1 ( 0.0%) | 22 ( 1.2%) |
| NIEP | 69 ( 3.4%) | 134 ( 6.7%) | 53 ( 2.8%) |
| NOA | 10 ( 0.5%) | 9 ( 0.4%) | 177 ( 9.4%) |
| ODC | 0 ( 0.0%) | 1 ( 0.0%) | 89 ( 4.7%) |
| RESIF | 22 ( 1.1%) | 5 ( 0.2%) | 27 ( 1.4%) |
| UIB/NORSAR | 62 ( 3.1%) | 62 ( 3.1%) | 100 ( 5.3%) |
failures of routing client: 0
failures of federator: 129
runs without errors: 0 (0.0%)
A history of these daily reports (in pdf format)as well as request
logs on station level are available at ftp://www.szgrf.bgr.de/pub/EidaAvailability,files
history_eida_availability_reports.tgz and
stationlogs_eida_availability.tgz, respectively. Reports
created after 15-08-2022 are available at https://www.szgrf.bgr.de/eidaqc_report/EidaAvailability
This report was automatically created at 14-06-2026 00:32 MEST usingpandoc 2.18.